Category: Functional verification – Regression

This is about the regression phase the climax of functional verification.

  • How to close last 20% verification faster?

    How you execute your first 80% of verification project, decides how long it will take to close the last 20 %.

    Last 20%, is hardest because during first 80%, project priorities typically change multiple times, redundant tests get added, disproportionate seeds are allocated to constrain random tests and often distributions on constraints are ignored or effects are not qualified. All this leads to bloated regressions, which are either underworking on right areas or overworking on wrong areas.

    Visualization of underworking or overworking regression
    Visualization of underworking or overworking regression

    It’s either of the underworking or overworking regression cases that make the closure the last 20% harder and longer. This symptom cannot be identified by the code coverage and requirements driven stimulus functional coverage alone.

    Let’s understand what are underworking regressions, overworking regressions and what are their effects.

    Overworking regressions

    Overworking regressions are overworking because they are failing to focus on right priorities. This happens due to following reasons.

    Good test bench architecture is capable of freely exploring the entire scope of the requirement specifications. While this is perfectly right way to architect the test bench but it’s equally important to tune it to focus on right areas depending on priorities during execution. Many designs are not even be implementing the complete specifications and the applications using design may not even be completely using all the features implemented.

    Test bench tuning is implemented by test cases. Test case tunes the constraints of stimulus generators and test bench components to make test bench focus on right areas.

    Due to complex interaction of test bench components and spread out nature of randomization it’s not possible to precisely predict of the effects of tuning the constraints in test bench. Especially when you have complex designs with lots of configurations and large state space.

    In such cases without proper insights, the constrained random could be working in area that you don’t care much. Even when it finds the bugs in this area they end up as distractions rather than value add.

    Right area of focus is dependent on different criteria’s and can keep changing. Hence it needs continuous improvisations. It’s not fixed target.

    Some of key criteria’s to be considered are following:

    • New designs
      • Application’s usage scope of design’s feature
      • Important features
      • Complex features
      • Key configurations
      • Area’s of ambiguity and late changes
    • Legacy designs
      • Area of design impacted due to features update
      • Areas of design which were not important in last version but are now in current version
      • Areas where most of the bugs were found in last revision
      • Design areas changing hands and being touched by new designers

    Underworking regressions

    In contrast to overworking regressions, underworking regressions slack. They have accumulated the baggage of the tests that effectively are not contributing to the verification progress.

    Symptoms of underworking regressions are

    • Multiple tests exercising same feature in exactly same way
    • Tests exercising features and configurations without primary operations
    • Tests wasting the simulation time with large delays
    • Test with very little randomization getting larger number of seeds

    Legacy designs verification environments are highly prone to becoming underworking regressions. This happens as tests accumulate over period of time without clarity on what was done in the past. Verification responsibility shifts hands. Every time it does both design and verification dilutes till new team gets hold of it.

    This intermediate state of paranoia and ambiguity often gives rise to lots of overlapping and trivial tests being added to regression. This leads to bloated and underperforming regressions hogging the resources.

    Effects of underworking or overworking regressions

    Both overworking and underworking regressions reflect in the absurd number of total tests for given design complexity and long regression turn around times.

    This results in wastage of time; compute farm resources, expensive simulator licenses and engineering resources. All this additional expenses without desired level of functional verification quality.

    Both overworking and underworking regressions are spending their time on non-critical areas. So the resulting failures from them lead to distraction of engineers from critical areas. When number of failures debugged to number of right priority RTL bugs filed ratio starts to go down, it’s time to poke at regressions.

    Please note simulator performance is not keeping up with the level of complexity.  If you are thinking of emulation keep following in mind:
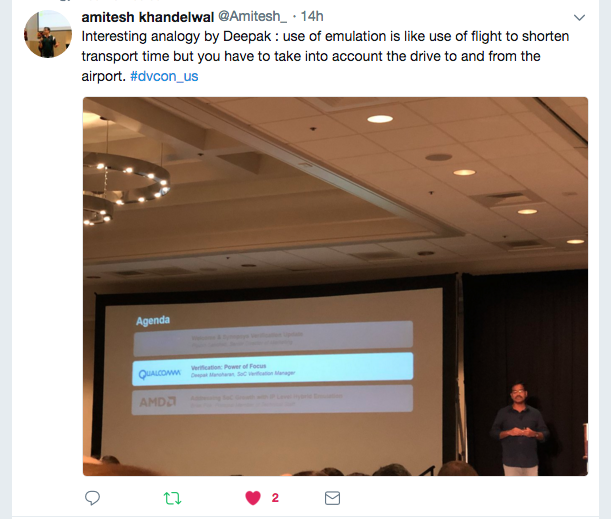
    Does emulation really shorten the time?
    Does emulation really shorten the time?

    Hence simulation cycles have to be utilized responsibly. We need to make every simulation tick count.

    Which means we need to optimize regressions to invest every tick, in proportion to priority and complexity of the features,  to achieve right functional verification quality within budget.

    We offer test suite stimulus audits using our framework  to provide insights, that can help you align your stimulus to your current project priorities, ensuring stimulus does what matters to your design and reducing the regression turn around time.

    Net effect you can optimize your regression to close your last 20% faster.
  • Debugging: The clues

    Debugging is like being detective. Debugging is iterative process of using the following clues to close on one of the suspects. Error messages in the log files acts as clues.

    Error message is result of check failure. There are three broad categories of checks in test bench and BFM.  Accordingly there are three different types of error messages relating to them. It’s the error message, which acts as first clue to start the debug process.

    Term event below is used to mean any form of information exchange.

    Three different error message types are, error messages from

    1. Immediate check failure resulting from event in test bench or BFM or DUT
    2. Timeout check failure waiting for event in test bench or BFM or DUT
    3. Global watchdog timeout check failure waiting for the end of test

    Ideally failures in the third category are sign of inadequate checks in the test bench and BFM.  Price for this weakness is increase in debug complexity.

    1. Immediate check failure 

    This is check failure immediately follow an event. Like checks done after receiving the packets. This category of failures provide clearly clue about mistakes. Check failure message calls out the expectation from event and what was actual event. This can ease the debug significantly. Sometimes this type of failures can be direct point to bug in the design.  For example consider BFM flagging CRC failure in the packet received from DUT. Assuming BFM has clean CRC logic, it’s directly pointing at incorrect CRC implementation inside the DUT.

    In spite of clarity of direction, it’s still advisable to check the configuration and stimulus for their correctness.  For example from configuration check one may find out CRC was disabled in DUT but BFM was not configured for it.

    Before filing the DUT bug:

    • Check if the configuration is legal,
    • Check if the stimulus is as per the specification
    • Check response is correctly detected by the BFM

    2. Timeout check failure 

    This failure is not result of immediate event. This is result of some event in the past. For example, consider a stimulus generation, which has to wait for response before generating the next stimulus. When the response never turns up the timeout check failure error will result. This check is failing for stimulus event generated in the past.

    Ideally every wait should be covered with the time out whether it’s required by specification or not. Because any wait can potentially become infinite wait. As additional safety measure also put a debug verbosity print indicating what event is being awaited.

    On the timeout check failures waiting for event things do before filing the bug are:

    • Check if the timeout value configured was correct, most of the times shorter value leads to false timeouts. Too large value of timeout leads to wastage of simulation cycles.
    • Sometimes it’s possible the event being awaited happened before the wait thread started, look for it in the logs and waveforms.
    • Check if the stimulus provided was timed correctly

    3. Global test bench watchdog timeout 

    Ideally only the timeout due to end of test (EOT) conditions should be covered this timeout.  EOT is made up of end of stimulus generation and end of stimulus execution.

    Timeout for “end of stimulus generation” should be implemented in the stimulus generators or test.  When its not done it will be caught by watchdog timeout. Penalty is longer simulation time to failure and harder debugs.

    Timeout due to “end of stimulus execution” is right candidate for this timeout. Any end of stimulus execution, which involves multiples interfaces, may not be possible to predict and set up specific timeout. This type of waiting for settling down of multiple interfaces interaction can be caught by this time out. For example, waiting for scoreboard to signal the end of test.

    On the watchdog time out failures things do before filing the bug:

    • Check if the timeout value configured is sufficient. As the development progresses this timeout value will have to grow
    • Check if the timeouts are due to end of stimulus generation. This can be done checking for expected stimulus from test and cross checking in the log files if the specified stimulus is generated. If not look for the wait condition in the stimulus generation sequences, which are not guarded by timeout. Add the time out and follow steps suggested in Timeout check failure waiting for event debug
    • If the stimulus generation has competed. Timeout is due to stimulus execution buckle up for hard ride. Take it step at a time. Understand the test intent and the DUT responses expected for the stimulus provided. Check them one by one to see where it has lost the link in the chain. These failures in well-architected test bench will be multi interface interaction issues. Adding specific timeout checks may be complicated and may not have sufficient ROI. If a check can be added to prevent the pain of debug go ahead and add it in the appropriate test bench component.
  • Debugging : The usual suspects

    Debugging is like being detective. Debugging is iterative process of using the  clues to close on one of the suspects. Error messages in the log files acts as clues.

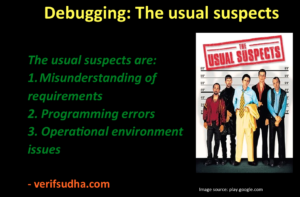
    Goal of debugger is to find those mistakes which are manifesting as a failure. Although not all the mistakes can be annotated following are three major categories of the mistakes. These are the usual suspects. Closing on culprit among suspects using the clues is the goal of the debug process.

    Following are the three broad categories of the mistakes or the usual suspects:

    Debugging: The usual suspects
    Debugging: The usual suspects

    1. Misunderstanding of requirements

    Misunderstanding of the requirements can lead to mistake in DUT, test bench or bus functional model implementation. Misunderstandings in one of the design or verification area will result in failure.

    The misunderstandings could be simple byte packing order in a packet or complex behavior during a corner case error recovery scenario. If there is same misunderstanding in both design and verification it will not result in error. That is reason why there is emphasis on keeping design and verification teams separate.

    Misunderstanding of requirements apart from resulting in incorrect implementation can also result in missing or partial implementations.

    Many a times at the start of the development not all the possible cases are thought out. Only some of them are implemented. As the development progress, they are rediscovered again through painful debugs.

    Misunderstanding requirement can manifest in many forms. Some of them are incorrect constraints, a flag set and forgotten to reset, inconsistent updates to a data structure, missing condition and incomplete understanding of possible cases, one extra or one less iteration etc.

    Interactive debuggers bundled with the simulators are also very useful in debugging this type of errors.

    Sometimes, misunderstandings in the requirements have to be resolved through the discussions between design and verification teams. Resolutions should be viewed from the point of view of the how it affects the final application. Resolution in case of ambiguities should  help the end application to meet its objective.

    2. Programming errors

    Bulk of failures are contributed by this type of mistakes. It’s close to impossible to annotate all the programming mistakes. It could be as simple as incorrect data type usage leading to data loss, which may be simple to spot. Others can be premature termination of threads, which may almost seem like well planned conspiracy against developer.

    Programming errors are due to misuse of the language constructs, verification methodologies and reusable components. Current popular HVL like System Verilog has LRM spanning over five hundred pages. It takes long time to master it. System Verilog is  a HVL built on HDL with OOPs support poses its own challenges in understanding when HDL domain constructs interacts with HVL domain constructs.  For example, System verilog threads concept is from HDL world and does not behave in OOPs friendly way.

    HVL programming also involves dealing with concurrency and notion of time. So even simple programming such as setting a flag variable, is no longer just about setting a flag, it should be set at right time by the right thread. Add to it another dimension of the object-oriented programming. Dynamic objects getting created and destroyed. Setting it in right time using right thread in right object. Too many rights make it difficult it get it right.

    Current popular verification methodology such as UVM has more than three hundred reusable classes to digest.  It’s certainly not easy to master these. Concepts like phasing become complicated due to legacy phasing and new phasing concepts operating together. Some concurrent, some bottom up, some top down can only make one fall down.

    Most of the code written is by copy and paste. That’s because lot of it is just boilerplate code. This also increases the chances of mistakes, which are hard to notice.

    Incorrect usage of reusable verification components is another source. Insufficient documents and examples for the reusable code makes reuse highly buggy in nature.

    Even when there is programming error, it does not jump out as programming error. It’s hidden behind layers of the translations.

    Thought process for verification engineer starts with the understanding the application world. Application world is abstracted to the test benches. Test bench implementation is mapped to verification methodology base classes and HVL code. Now there are series of the transformation have taken place.

    Debugger will have to peel these layers one by one to discover the issue.  It requires one to map the problem symptom showing up at different level of abstraction to programming mistake deep buried somewhere.

    Typically programming error debugging can be done effectively with the interactive debuggers provided by simulator. Those allow the classic software debug environment such as ability put breakpoints, single stepping, being able to see variable values, object contents, active threads visualization etc.

    Also simulators provide switches that can dump additional debug information to provide insights into problem. For example incorrect constraint usage failures are assisted by providing the information about various class property values being dumped into log at the point of constraint failure.

    3. Operational environment problems

    These are set of mistakes in using the operational environment setup. These could be mistakes committed in the Makefiles used for building, compiling and simulating code, scripts for productivity, setting up libraries of reusable internal or third party vendors components, simulators and other tools etc.

    GNU make issues can manifest as new code changes not reflecting in simulation. Leading to same error showing up again even after fix. Check the code picked up by the compile to see if the new changes are reflected. Linking issues can show up at times due to issues unknown. That’s why a good clean target is as important as build targets. This will ensure many unproductive issues are kept away. Makefile and rules organization can reach crazy levels complication. One simple point to keep in mind is inside all the make black magic, two important commands can guide debug. They are command for compile and command for simulation. Make utility provides special switches to gain additional insights. Make is a different world by itself.

    Perl, Python or TCL scripts used for productivity can report incorrect data or do an incorrect generation.  Always know a way to create results or generate them manually. Manual results can be used to match with the data reported or generated by scripts to gain insights for debug.

    Rare but at times the simulator’s mistakes may also get discovered. Simulator behavior may not be in compliance with the LRM. These can be hard to debug and lengthy to resolve.

  • Debugging: Being detective

    Debugging is like a detective work. It’s an iterative process to eliminate the suspects using the clues to reach the cause. The detective work requires one to think from multiple angles.  Search for clues. Take a route guided by the clues available. Sometimes it can hit the dead-end. Come back and restart. Take newer route guided by new clues.

    Screen shot 2016-05-26 at 1.53.35 PM


    Prerequisites for productive debugging

    Debugging is tough because it takes multidisciplinary understanding to crack open the root cause leading to failure. When the test fails, in order to productively debug it effectively the knowledge required can be overwhelming. In reality many manage with far less knowledge than desired resulting in longer debug cycles.

    Debugger needs to understand:

    • Design specific
      • Understanding requirement specification either in the form of standard specification or custom specifications
      • Design under test (DUT)’s implementation. Treat every DUT a transfer function transforming input to some other form of useful output
      • Understanding of the test bench architecture
      • Understanding of the test’s intent and expectations
      • Testbench logging
    • Generic
    • Environment specific
      • Simulator’s user interface understanding
      • Basics of the operating system’s user interface
      • Makefile, scripts and utilities

    Preparation for debugging

    Tests command lines in regression have minimum logging verbosity. This implies log files contain very little information. It’s not sufficient for debug. Run the test with the full debug verbosity. This will provide the additional information required for debugging.

    Logging also needs to be architected in the test environment. Logging architecture is not just message verbosity classification. Most often this is a highly ignored area of the test bench architecture. It takes a heavy toll on the debug productivity.

    Benchmark of good logging is that, it should be possible to accomplish first goal of isolating the issue between the DUT or testbench. The information required for this isolation is all based on requirement specification. Only when there is issue with DUT one should need waveform dumps. Waveform dumps generation takes longer simulation cycles.

    Basic preparation for the debug is to have the logs with the debug verbosity and waveform dumps.

    If regression status had achieved some level of stability in the past and it’s just recent changes that have lead to failures then one can also follow a comparative debug option. Where logs from the recent passing test can be compared with the current failing test to spot the difference. There can be many differences. Carefully eliminate the differences that do not matter. Focus on the differences that can potentially signal the cause for the failure. Look through the code commit history in the version control system to spot the culprit changes causing the problem. This can work as a very effective technique for the mature verification solutions with fewer changes. There are new tools being developed to automate this process. If there is no luck here proceed to some real debugging.

    Definition of debugging

    There is an unmet expectation leading to failure of test. Short definition of debugging is to find out why it’s not met. Expectations are not met because of mistakes.

    Debugger task is to find out those mistakes. In order to find the mistakes he first needs to know, what are different types of mistakes possible? It’s almost impossible to annotate all. That’s genius of the human mind. It keeps on inventing newer ways of committing mistakes. Only an attempt can be made to classify them in broad categories for a domain. These categories act as usual suspects.

    In order to zero-in on culprits among suspects clues are required. Clues guide debugger towards the right suspects. First clue is in the log file in the form of error signature. It’s a first visible manifestation of the mistake. Error signature is result of failure of check in test bench or assertion in DUT or simulator tool. This discussion will focus on checks in test bench because they contribute to bulk of failures. These checks can be broadly classified into three different types of checks in the test bench. These checks categories are the clues.

    Process of Debugging

    Now that we have suspects and clues, there are two ways to go about, first way is from failure error message at the end of log file to cause (back tracing) or second way is test intent to cause (forward tracing). Tracing is done using the log files, waveforms and debugger tools. It involves traversing information of different layers of abstractions to reach the actual mistake.

    First step of debugging test failure is to isolate source of the mistake between test bench and design under test (DUT).  Mistakes in test bench results in generation of incorrect stimulus and/or incorrect implementation of checks. Mistakes in DUT implementation will result in incorrect response from the DUT to stimulus from the test bench.

    In order to perform this first step, debug engineer should understand test intent and for given test what are the possible legal stimulus and expected response according to requirement specification.

    Debug engineer using this understanding will have to figure out if the stimulus is generated and applied correctly to the DUT interfaces. Stimulus generation correctness is confirmed by using stimulus related information from log files. Stimulus application correctness is confirmed by looking at the corresponding interface signals in the waveform. If it is not correct then utilizing the understanding of the architecture of the test bench and stimulus flow through components isolate it to one the test bench components. Interactive debuggers can also be used to trace stimulus flow through test bench to isolate it to one of the test bench components and pinpoint to issues within the component.

    If the stimulus is both generated and applied correctly to DUT interfaces, next step is to check correctness of response from the DUT. If the response from DUT is not correct then using the understanding the DUT micro-architecture, data flow path and control path isolate it to one of the blocks of DUT. Internal RTL debug is mostly based on the waveforms.

    If the response from the DUT is correct and it’s collected correctly by test bench next step is to figure out why the check is misfiring in the test bench. This debug is similar to debugging incorrect stimulus problems in the test bench as described above.

    Debug engineer while checking for correctness will have to trace stimulus and response through multiple abstractions and relate them across abstractions. For example a stimulus generated at the application level may need to be traced through transaction level to physical signal level. It should be thought out and planned out in the logging of the test bench components to ease this correlation and traversal. Recent developments in the protocol aware debuggers are easing this in standards based protocols debug. Bottom line is test bench should be architected for the debugging and be self sufficient in debug.

    Does this understanding of mistake categories (suspects) or error message types (clues) can lead debug engineer directly to root cause? No. Let’s not create any false hope. These are not going to pinpoint the mistakes. However these will help debug engineer during detective debug work. So let’s look at categories of suspects and clues in bit more detail.

  • Full Regressions in Verification

    Full regressions are ideally are required for every change. But it’s not practically possible in many real life use cases. Role of regression is to keep all passing tests in passing state they have to be run periodically and check their status.  If some of the tests found failing, fix them and get back to passing state. This process is called regression. Typically combination of full regression and check-in regressions are used to maintain the health of overall regressions.

    Before a test is declared as passing it should be exercised in all the applicable configurations and test benches. If there are multiple test benches care should be taken to exercise in all the different test bench areas. After all these qualifications if the test is still passing it becomes part of the periodic regressions. Basically regression is a process of protecting what has been already built.

    Full regression is run with regress list. A regress list contains the series of commands that can be run in a batch mode to run all the qualified tests. It will contain both the directed and constrained random tests. Unless it’s strictly directed test, it should be seeded appropriately. A strictly directed test has fixed configurations and fixed stimulus sequence. In a constrained random environment it’s rather hard to write a strictly directed test. Directed tests of the constrained random environment randomize the configurations but keep the stimulus sequence fixed. Based on the state space coverage a test is providing the test should be seeded. Seeding constrained random tests helps extracts full value from it.

    Typically full regressions are run with the seeds. Number of seeds across tests can be scaled according to value of test, license and compute resources availability.  

    Who should run the full regression?

    Typically single owner in verification team owns full regressions. The results published by the regression owner should be used as official number for tracking status. Regression phase project management is really challenging. Key decision on exceptions to rules laid have to be made to meet the critical milestones.

    Considering the sheer size of the full regressions it’s not feasible for everyone to run full regressions.Only exception for this rule is for the major code changes or close to critical milestones, even the developers doing the code changes can run the full regressions to gain additional confidence in their changes.

    Full regressions result reference should be from single source to maintain consistency and validity. Like a legal document, it should be stamped and signed by full regression owner.

    Screen shot 2016-05-23 at 10.14.58 PM


    How periodically full regressions should be run?

    Given the compute capacity, total licenses available, total number of tests in regression will set the limit on minimum duration required to run the complete regression. This is a real constraint. Let’s call it as physics limit. Everything else should be worked around it to meet the requirements.

    Next important factor in deciding frequency should be driven by the rate of the new developments. If the new code changes are happening once every month then it’s sufficient to run it once every month. This may happen at the later phase of the project close to tape out. During the peak of development, rate of code change will be far faster with several code changes coming every hour. When the rate code change is far faster than full regression time then it becomes challenging to decide the frequency of full regressions.

    During development phase, attempt should be made to run as frequently as possible guided by the full regression physics limit. What happens when the full regressions are delayed? Check-in regression will attempt to hold the fort but it’s on best effort basis. It’s possible that some check-in can cause the damage to full regression results. Earlier this damage is detected better are chances that it can be contained and recovered. A very simple solution might be to just back out the culprit changes. But as the time passes and more code changes are committed to development branch the impact of damage increases. It becomes complicated even to back out the changes.

    Now when the physical limit for full regression is very large to be useful then full regressions can be broken into multiple levels. Group the tests based on the importance of the configurations and features. These subsets should be divided till the time limits reach a useful point. There on these subsets can be run at acceptable frequency. Important levels be should be run more frequently. It’s like choosing to save most valuable possessions in case of emergencies.

    When to enable coverage in full regressions?

    Answer depends on the phase of the project. At early development phases this is not required. Coverage of any form is not seriously analyzed during early phases of development. So early phase full regressions coverage need not be enabled. Enabling coverage hits on the run time performance. Enable it when it’s planned to be looked in to. Generating coverage reports that are not analyzed is waste of time and resources.

    At the later stage when development matures coverage should be enabled. The run time hit it takes has to be taken into consideration during planning regression duration. Frequency of enabling coverage can reduced compared to frequency of full regression based on the granularity of the coverage tracking.

    A simple rule to figure out when to start enabling coverage is, unless bugs rate starts showing the downward trend coverage analysis is an unaffordable luxury. When the bug rate comes under control, coverage convergence process can be started. That’s when it makes sense to enable the coverage to find holes and tune stimulus to uncover bugs in those areas. Bottom line, do not enable unless there is bandwidth available to use the coverage data generated.

    What do with the failures of full regression?

    Debug. Considering the total failures process has to be defined to make debug productive.

    The sheer size of failure numbers can become scary at times. Point to keep in mind is it’s not about total failure numbers but the debug effort involved which is more important. Debug effort involved is not directly proportional to total failing numbers in many cases. This is because the unique failures within total failures may be lesser. Debug effort is required for debugging the unique failures and not all the failures.

    It’s important to group the failures with same failure signature. Among this group debug the failure that is showing earliest in simulation time. Picking the one showing earliest makes it faster to simulate the failing scenario with the debug verbosity for logging and waveform dumps.

    Unique failures have to be assigned out. Till they are debugged either they can be excluded from further regression or excluded from analysis for failure debug assignment.  Failures debugged should be classified as design, test bench and bus functional model issues. Bugs should be tracked through a bug tracking system. The failing tests should be re-enabled in the regression after the fixes are committed in development branch.

    Extra points for making list of failures expected to pass before starting next full regression. This gives an idea of what to expect. It also gives window to pull in any additional fixes to make the best of the next full regression.

  • Check-in regressions in Verification

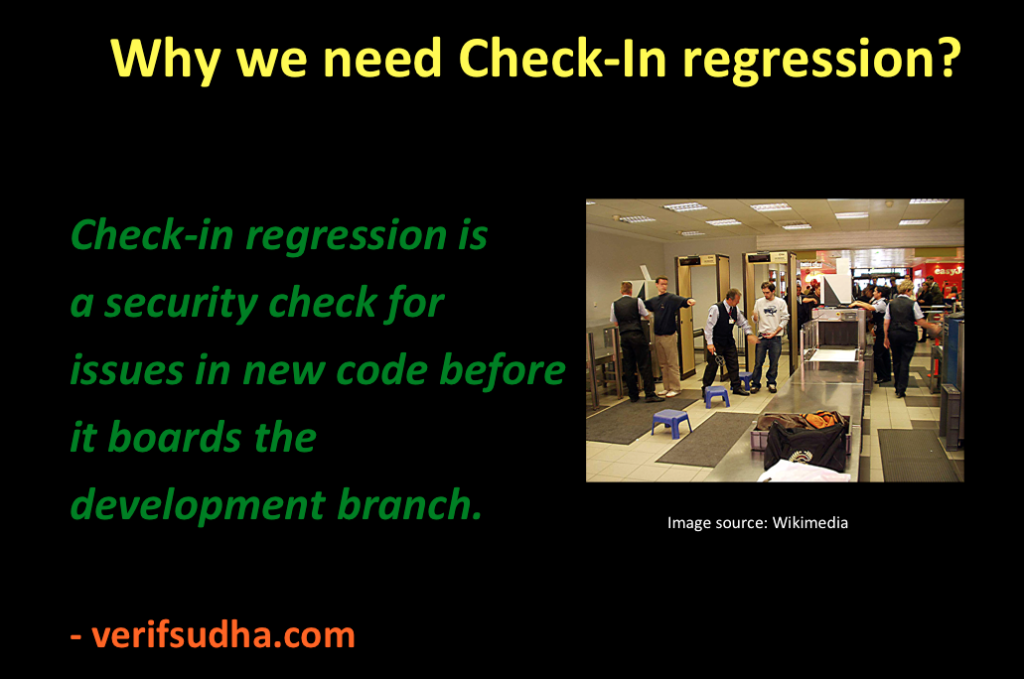
    Regressions are process to keep the passing tests in passing state. Ideally in order to do that full regressions should be run for every change.Since the full regression cannot be run for every change, a selected sub set of tests are run before committing the new changes to development code branch. This subset is called check-in regression. This is expected to minimize the possibilities of the spikes in the failure numbers. This is one of the key component to achieve functional verification quality.

    Screen shot 2016-05-23 at 7.44.10 PM

    Some of the immediate questions about check-in regression would be, how many tests should be selected?  What should be the selection criteria? How long should it run?

    Duration of check-in regression

    Most important question of all is what is the right duration of check-in regression? This is very critical because it limits the speed of the development. Shorter but inadequate check-in regressions may run faster but still slows down development due to failure spikes. Longer but sufficient, may seem right but defeats the purpose of check-in regression. Developers will look for ways to bypass it to avoid the delay. A right balance is the key. Some of the pointers helpful in achieving this balance are discussed below.

    Screen shot 2016-05-23 at 10.27.41 PM


    Thought process for definition of check-in regression

    Check-in regression is all about width and not about depth. It need not go deep in any one area. It should touch all the major features of DUT.

    One of the tools driven approach to selects tests for check-in regression can be based on test grading. Run the full regressions, grade your tests and add the tests that provide the highest coverage. Fair enough. Generally problem may not be simpler. There may be multiple test bench areas. Merging the entire test grading across the test bench areas can sometimes be challenging or simulator you are using may not be supporting it. This is one of the simplest approaches and can be a starting point.

    Test grading based selection is a theoretically correct answer.  That’s because tool can never understand what is really important to your project. Check-in regression should not only broadly cover all the DUT features, but broadly cover features, which are important to project as well. A carefully tailored manual approach is best suited to achieve the best results.

    Manual approach to defining the check-in regression is:

    • List all your test bench areas if there are multiple test benches
    • List all the major configurations parameters and combinations
    • List all the tests grouped under major functional areas: Normal operation, error injection, low power etc.

    Order each of the areas based their importance in DUT use cases. The features and configuration, which are lower on criticality and use cases, will go down in the list.

    Now select few tests from each of the functional areas. Spread them out across the configurations and test benches selected to maximize the unique coverage.

    Effective check-in regression definition is not a one-time process. It’s a continuous process till the chip tape out. Tests have to be swapped, added and deleted to get best coverage per test per unit time. Check-in regression is like plant in pot that needs to be continuously trimmed and cared for to get the best out of it.

    Test selection criteria for check-in regression

    Stability is another very important criteria for test selection in the check-in regression.

    Screen shot 2016-05-23 at 4.19.12 PM

    Typically selection of directed tests are favored over the constrained random tests. That’s because of the stability they offer. Check-in regression instability causes confusion to developers. Developers will soon lose confidence in the check-in regression. Instability leads to slow down in the development process. Check-in regressions stability is one of the critical bottlenecks of the development speed.  

    As long as constrained random tests can also offer reasonable stability they can also be part of the check-in regression. Care should be taken to qualify them sufficiently before making them part of the check-in regression. It should not be qualified as part of check-in regressions. This causes problem for everyone and should be avoided. In fact the constrained random tests chosen for the check-in should be run with sufficient seeds and should be curated for some time as part of full regression. When it starts showing good pass rate it can move in to the check-in regression.

    Tests that run for long duration should be avoided. When there is sufficient compute power available to run tests in parallel, the long running test will become the bottleneck. If its functionality is must for the check-in regressions consider splitting into multiple smaller tests.

    To ensure the shortest run time for selected test ensure that:

    • Logging verbosity of the tests should be set to minimum. Additional logging verbosity can add to run time
    • Code coverage and Functional coverage should not be enabled. It’s not useful with the check-in regressions and adds to execution time.
    • Waveform dumping should not be enabled in check-in regression

    Typically above ones are not violated intentionally but accidentally these can happen. Checks should be put in place to prevent it.

    Simulator selection criteria for check-in regression

    Third party IPs and VIPs vendors have to support it multiple simulators. In such cases tests can be run using the primary simulator in the check-in regression. Compile sanity is sufficient for secondary simulators.

    Primary simulator is the one, which has highest licenses. Including test runs with secondary simulators can potentially lead to license bottlenecks. Only bottleneck for check-in regression should be ideally test run time only.

    Enforcing check-in regression

    Process should be put in place to ensure no code commit to development branch without running the check-in regression. There are cases when developer has run check-in regression and about to commit the code and sees that there is code commits by other developers to the same files. When the updated code is resolved with commits from other developers, check-in regression should be run again. Being pessimistic and paranoid pays.

    It’s tempting to cover lot of things in check-in regression. One need to keep in mind check-in regressions is never going to be fully fool proof. It’s meant to reduce major failure peaks and frequency of such peaks. It is like a bulletproof jacket that can save your life most of the time but cannot guarantee it all the time.

    Effectiveness of check-in regression should be measured by the number of the failure peaks in full regression due to faulty code changes sneaking through check-in regression periodically. If the frequency of failures is unacceptable check-in regression definition process should be repeated and test list should be updated.  

  • Role of Regressions in Verification

    Imagine a floor of the engineers working on design and verification of an interesting DUT. Designers are improving DUT’s strength everyday by adding new features. Verification team is busy catching up with the DUT’s features in test bench. Tests are written for the DUT’s features ready for verification. First milestone is approaching. Required features are ready in DUT, Test bench, BFM and in tests. Tests are executed for features required for milestone. Debug at war pace around for few days. Feature has passed all tests.

    Parents of DUT and test bench are both happy. Little celebrations. Preparations start for next milestone.

    Next question is.. 

    What to do with passing tests?

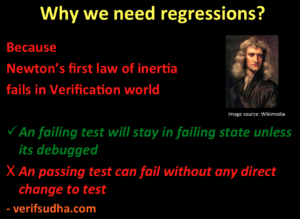
    If the Newton’s first law of inertia had stayed true in verification by keeping a passing test passing all the time, we did not have to do anything for passing tests. Unfortunately that’s not true.

    Screen shot 2016-05-25 at 3.38.34 PM

    Really, no kidding please. Are you saying, Newton’s first law is not holding up?

    Yes. Passing test will not stay in passing state.

    Why does passing test fail?

    Although test itself is not changing, new seeds, changes to test bench code or DUT code, which is not even directly related to the test can lead to test failures. There is a complex web of dependency between test, test bench and DUT. Sometimes it may not be directly evident.

    Thus a test, which is not changed, can still fail due to changes in other parts of the code. This means there is no guarantee that tests once passing will not stay in passing state. There needs to be effort and process to keep passing tests passing. Yes it may sound bit funny to engineers new to verification. But it’s true. Test in passing state will not stay passing state unless everything is frozen forever. This will not happen unless a company is wrapping up its business.

    What can we do to keep passing test in passing?

    Note that it’s impossible to keep passing test in passing state all the time during development. A passing test will fail several times throughout development cycles to chip tape out. A failure by itself is not bad. As long it is catching issues without significantly affecting forward progress.

    What we do not want is sudden rise in failures, which forces to stop the development till they are fixed. This is bad for schedule as it prevents the forward progress.

    Okay. I get that. But..

    What can be done to increase the chances of keeping passing test passing?

    Yes that’s a right question. We can only strive to improve chances of keeping it in passing state.

    Every new feature being introduced will has potential to cause failure to already passing tests.  This happens, due to incomplete verification of already verified feature. It could be a missed configuration, missed stimulus or missing check for already verified feature. Random seeds or new checks added, new seeds could be leading to discovery of these failures. Another major cause is cross feature interaction. Interaction of the existing features with the new features can discover cases leading to failures in already passing tests.

    Also it’s the humans who are developing the code and not the robots. Human mistakes are bound to happen. It’s not possible to completely eliminate it.

    Regressions are the process to contain and minimize the impact of new changes on already passing tests. Regression in simple words is running all passing tests before every change is committed to development branch. This would ensure no bad changes can come in and passing test remains passing. This is not practically feasible as the number of tests grows. It will not be possible to run all the tests before committing every change to development branch.

    This is not possible because of the time and resource limitations. If the entire regression can be completed within 30 minutes may be one run entire regressions before every check-in. But that’s hardly the case. Entire regressions can range from overnight to few days for any reasonably useful DUT. This delay is not acceptable for qualifying every change. If done can seriously slow down the development.

    One common strategy used is to create a subset of full regression called check-in regression to be run before every code commit to development branch. This is designed to minimize the spikes in the failures of regression. Full regressions are run at a predetermined frequency separately at much lesser frequency than check-in regression.

  • Debugging in the System Verilog/VMM Constrained Random Verification[CRV] test benches

    70 % of asic design goes in verification and 70 % of verification goes in debugging.

    Planning for the debugging goes a long way. Feature by feature the way we architect the test bench pay some attention as to how will it be debugged. This strategy will pay back heavily.

    One old principle is don’t forget the basics. Understand the ground rules well.

    In verification ground rule is generate the stimulus and check the response. That’s it. Be sure to wear your verification goggle all the time.

    In the directed case it would be evident just by reading the test source code.

    The same is not true when one looks at the the Constrained random verification(CRV) test benches. Although the ground rule is still the same.

    Well debugging the CRV test benches is little different ball game. Now one needs to figure out the stimulus  generated from the test logs. There is no source code to refer on the lines of directed case.

    I am not going to talk about technicals of the vmm_logs. May be I will put a word or two as to what customization can be done to make it more effective.

    12 Tips for debug
    0. Typical use case for logs files is, they are searched(grepped) and not read line by line. So design the regular expression friendly logging messages

    1. Just because they are grepped does not give you a license to go wild and print the universe. Follow some good logging etiquette. Well formatted information is worth the time spent in putting up the format.
    Address map, details of transactions, configurations needs be formatted to ease the read

    2. Implement intent driven logging macros. Intent driven macros could distinguish between the messages that give out information about specification, implementation, test bench specific etc. This can help in debugging across teams. Let’s look at a case where the unit test bench gets ported to system. System team might just be interested in the messages that give out the spec information and they may not be interested in the test bench specific messages. So it would be good to have this control

    3. With the vmm logging macros tend to print out multi line messages. Do customization to make them single line. Also group the related multiple lines that need to go together in a string data type and print it out with the single call to messaging macro. While built in vmm component logging is useful it can be big distraction and can increase your log file sizes beyond wave dumps. So have knobs to turn off this internal logging and enable only your own testbench logging or together.

    4. It should be very straightforward to find out the stimulus generated and the response given out by the DUT. VMM test benches heavily utilize the concept of the transaction and transactor. Transaction go via
    the channels. The built in logging of the channels puts out messages about transaction being added/removed. This can be very informative for the stimulus and response extraction.

    5. Debug messages cannot be put just for the sake of it. There needs to two views that needs balanced. One is being able to have as complete information as possible being available in the logs when the highest
    verbosity is enabled but the second one is ease of localizing the issue using a question/answer/elimination.

    Few simple quick information to help ruling out the basic issues. Thereon eliminations. First one is : Is it really a RTL or test bench issue. If its test bench issue then it should answer is it originating in generator, transactor, BFM, score board, driver, checker etc.

    6. For test bench issues after its localized to a component put enough information to be able to figure out what is the state of different threads in the component. If it’s waiting for some event it will go a long way to put that debug message as to what it is waiting for

    7. End of test itself can be multi phased. Put enough information to indicate as to which phase of end of test is being waited on

    8. Even when it’s closed as RTL issue messages need to be clear enough to convince the designer. It should be easy enough to give the picture of scenario as designer would imagine

    9. Build the set of frequently used regular expressions and use the egrep to find out the complete sequence of event that took place. This bigger picture is very vital

    10. Have an easy mechanism to identify the requests and corresponding response. For the buses that allow multiple outstanding requests and allows out of order completion it goes a long way to build this
    identification mechanism. Even though the bus may have some id mechanism of the transactions as they get reused it might be tough to debug. Go ahead and add TB id for the transaction as well that is unique throughout the sims and map the completions on to this ID and it greatly ease the debug

    11. Don’t plan to debug everything using logs and thus put everything in logs. Plan on using the single stepping/watch capabilities of simulators. Synopsys DVE works great for the test bench debugs. This step means extra time but trying to solve all debugging needs using logs would reduce the logging efficiency

    12. Put enough note verbosity message to be able to figure out the timestamp from where the dumps needs to be started and if you can decide if the dumps are needed that would be great

    Test Bench issue Preventions:

    0. Go defensive and be paranoid in terms of coding. Next time you are 100 % sure to find the element you are going to look for in the queue where you are tracking transaction completion still add an fatal error statement if its not found. These checks go a long way in catching the issue at root. Otherwise these can morph into very tricky failures

    1. Having lots of failure with the similar error message but for a different causes is an indication of more granular checks are needed. More granular checks make it easier to debug

    2. Pay attention while doing copy/paste to avoid those extra compile cycles and painful debug cycles

    3. One aspect that is different coding in SV compared to C/C++ is the time dimension. Be aware that hardware interfaces are parallel while something is being processed at one interface there can be activity on the other interfaces as well. This thought process can save you from normal items that come in as a part of dependency but also take care of race conditions

    4. Multiple threads accessing the shared resources is one more issue. While one writes the code it might be tough to imagine the concurrency of threads. Build your own way to imagine this concurrency and put the
    needed protection of the semaphores

    5. Zero time execution is another trap. Beware the vmm_channel put and get are blocking. What it means is on every channel put/get the scheduling coin gets tossed again. All the contesting threads get a  chance to compete and execute. While in your head you may be thinking of only the two components connected by channel to be active but its not true other components can also get a chance